Sqaure Wave Synthesis Harmonic Editor

Post your FreeBASIC source, examples, tips and tricks here. Please don’t post code without including an explanation.
Zamaster
Posts: 1025
Joined: Jun 20, 2005 21:40
Contact:

Sqaure Wave Synthesis Harmonic Editor

Post by Zamaster »

Okay, so I made this today for researching purposes. Just play with it and youll see what it does. I need help though, when you run it, see if you can create a curved shape of some sort or another interesting shape. If you can, please post a screenshot of it.

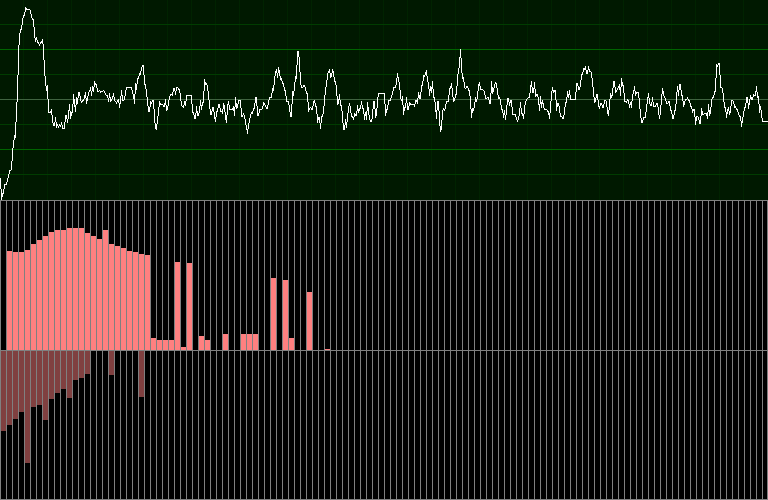
For those of you who know what this is, yeah I stole the editing layout concept from a VSTi called sytrus. The log mapping mode just makes it easier to make small changes in harmonic amplitudes.

Code: Select all


'Editables!

Const ScreenX as integer = 768
Const ScreenY as integer = 500

Const Harmonics as integer = 32

Const VEWidth    as integer = 768
Const ViewHeight as integer = 200
Const EditHeight as integer = 300


'Dont edit these!

Const ViewHeight8 as double = ViewHeight/8
Const ViewWidth32 as double = VEWidth/32 

Const VEHeight as integer = ViewHeight+EditHeight

Const BEST_FIT as integer = 0
Const TRUNCATE as integer = 1
Const MAX_FIT  as integer = 2
Dim shared as integer WindowingMode

Const HarWidth as double  = VEWidth / Harmonics
Const OffYPos  as integer = ViewHeight + (EditHeight/2)

Const WaveYMP as integer = ViewHeight/2
Const EditYMP as integer = EditHeight/2-1

Const RecEY as double = 1/EditYMP
Const RecW  as double = 1/VEWidth

Const LOGARITHMIC_MAP AS integer = 1
Const LINEAR_MAP As integer = 2
Dim shared as integer MappingMode

Type HarmonicType
    as double Amplitude  ,_
              Offset     ,_
              CycleMul
End Type

Dim shared as double        Sample(1 to VEWidth)
Dim shared as HarmonicType  Harmonic(1 to Harmonics)
Dim as integer i
For i = 1 to Harmonics
    Harmonic(i).CycleMul = i*2
Next i


Dim shared as uinteger OScopeColors(1 to 7)
OScopeColors(1) = RGB(00,60,00)
OScopeColors(2) = RGB(00,100,00)
OScopeColors(3) = OScopeColors(1)
OScopeColors(4) = RGB(64,100,64)
OScopeColors(5) = OScopeColors(1)
OScopeColors(6) = OScopeColors(2)
OScopeColors(7) = OScopeColors(1)

Sub DrawView()
    Dim as integer i, PRE, sm1, sm2
    Line (0,0)-(VEWidth-1,ViewHeight-1), RGB(00,25,0), BF  
    For i = 1 to 31
        PRE = i*ViewWidth32-1
        Line (PRE,0)-(PRE,ViewHeight-1), RGB(00,35,00)
    Next i
    For i = 1 to 7
        PRE = i*ViewHeight8-1
        Line (0,PRE)-(VEWidth-1,PRE), OScopeColors(i)
    Next i
    sm2 = Sample(i)*WaveYMP + WaveYMP - 1
    If sm2 < 0 Then sm2 = 0
    For i = 1 to VEWidth-1
        sm1 = sm2
        sm2 = Sample(i+1)*WaveYMP + WaveYMP - 1
        If sm2 < 0 Then sm2 = 0
        Line (i-1,sm1)-(i,sm2), &HFFFFFF
    Next i
End Sub
Sub DrawEdit()
    Dim as integer i, PRE, PRE2, EHeight
    Line (0,ViewHeight)-(VEWidth-1,VEHeight-1), RGB(128,128,128), B
    Line (0,OffYPos)-(VEWidth-1,OffYPos), RGB(128,128,128)
    For i = 1 to Harmonics-1
        PRE = i * HarWidth
        Line (PRE, ViewHeight)-(PRE,VEHeight-1), RGB(128,128,128)
    Next i
    For i = 1 to Harmonics
        PRE  = (i-1)*HarWidth+1
        PRE2 = PRE+HarWidth-2
        With Harmonic(i)
            If .Amplitude>0 Then
                EHeight = OffYPos-.Amplitude*EditYMP
                Line (PRE,EHeight)-(PRE2,OffYPos-1), RGB(255,128,128), BF
            Endif
            If .Offset>0 Then
                EHeight = OffYPos+.Offset*EditYMP
                Line (PRE,OffYPos+1)-(PRE2,EHeight), RGB(128,64,64), BF
            Endif
        End With
    Next i
End Sub

Function Sqw(x as double) as double
    Dim as integer xi
    xi = int(abs(x))+1
    Return (xi mod 2) * 2 - 1
End function

Sub AddHarmonics()
    Dim as integer i, Smp
    Dim as double  wpos, largest, diff
    
    If MappingMode = LOGARITHMIC_MAP Then
        For Smp = 1 to VEWidth
            Sample(Smp) = 0
            For i = 1 to Harmonics
                With Harmonic(i)
                    If .Amplitude > 0 Then
                        Sample(Smp) += (Sqw(((.Offset*2/.CycleMul)+wpos)*.CycleMul)*(0.1^(1-.Amplitude))*.Amplitude)
                    Endif
                End With
            Next i
            wpos += RecW
        Next Smp
    Else
        For Smp = 1 to VEWidth
            Sample(Smp) = 0
            For i = 1 to Harmonics
                With Harmonic(i)
                    If .Amplitude > 0 Then
                        Sample(Smp) += Sqw(((.Offset*2/.CycleMul)+wpos)*.CycleMul)*.Amplitude
                    Endif
                End With
            Next i
            wpos += RecW
        Next Smp
    Endif
    Select Case WindowingMode
    Case TRUNCATE
        For Smp = 1 to VEWidth
            If Sample(Smp) > 1 Then 
                Sample(Smp) = 1
            Elseif Sample(Smp) < -1 Then
                Sample(Smp) = -1
            Endif
        Next SMP
    Case BEST_FIT
        For Smp = 1 to VEWidth
            If Abs(Sample(Smp)) > largest Then largest = Abs(Sample(Smp))
        Next Smp
        diff = 1/largest
        For Smp = 1 to VEWidth
            If Abs(Sample(Smp)) > 0 Then Sample(Smp) *= diff
        Next Smp
    Case MAX_FIT
        For Smp = 1 to VEWidth
            If Abs(Sample(Smp)) > largest Then largest = Abs(Sample(Smp))
        Next Smp
        If largest > 1 Then
            diff = 1/largest
            For Smp = 1 to VEWidth
                Sample(Smp) *= diff
            Next Smp
        Endif
    End Select
End Sub


Dim as integer mx, my, mb
Dim as integer CWindow
Dim as double  CurHar, Amnt

Screenres ScreenX,ScreenY,32,2,8
screenset 1,0


Print "Use the mouse to modify the harmonic"
Print "Amplitude and Offset by clicking in "
Print "either the top or bottom row of collums."
Print "Top = Amplitude, Bottom = Offset"
Print
Print
Print "Windowing mode keyboard settings:"
Print "1 = Truncate"
Print "2 = Fit only maximum"
Print "3 = Fit to maximum"
Print
Print "Amplitude mapping mode keyboard settings:"
Print "Q = Linear"
Print "W = Logarithmic"
Print
Print
Print "Press any key to continue..."
Flip
sleep

WindowingMode = MAX_FIT
MappingMode = LOGARITHMIC_MAP

Do
    Cls
    getmouse mx, my,,mb
    If Multikey(&H2) Then 
        WindowingMode = TRUNCATE
    ElseIf Multikey(&H3) Then 
        WindowingMode = MAX_FIT
    ElseIf Multikey(&H4) Then 
        WindowingMode = BEST_FIT
    Endif
    
    If Multikey(&H10) Then
        MappingMode = LINEAR_MAP
    Elseif Multikey(&H11) Then
        MappingMode = LOGARITHMIC_MAP
    Endif
    
    If mb > 0 Then
        If CWindow = 0 Then
            If my > ViewHeight Then
                If my < OffYPos Then
                    CWindow = 1
                Else
                    CWindow = 2
                Endif
            Endif
        Endif
        If CWindow = 1 Then
            CurHar = int(mx/HarWidth)+1
            Amnt = (OffYPos-my)
            If CurHar < 1 Then 
                CurHar = 1
            Elseif CurHar > Harmonics Then
                CurHar = Harmonics
            Endif
            If Amnt > EditYMP Then 
                Amnt = EditYMP
            Elseif Amnt < 0 Then
                Amnt = 0
            Endif
            Amnt *= RecEY
            Harmonic(CurHar).Amplitude = Amnt
        Elseif CWindow = 2 Then
            CurHar = int(mx/HarWidth)+1
            Amnt = (my-OffYPos)
            If CurHar < 1 Then 
                CurHar = 1
            Elseif CurHar > Harmonics Then
                CurHar = Harmonics
            Endif
            If Amnt > EditYMP Then 
                Amnt = EditYMP
            Elseif Amnt < 0 Then
                Amnt = 0
            Endif
            Amnt *= RecEY
            Harmonic(CurHar).Offset = Amnt
        Endif
    Elseif mb <> -1 Then
        CWindow = 0
    Endif
    AddHarmonics
    DrawView
    DrawEdit
    Flip
Loop until multikey(1)

end

Richard
Posts: 3096
Joined: Jan 15, 2007 20:44
Location: Australia

Post by Richard »

What you are doing is synthesising step waveforms using “Walsh-Hadamard” functions or transforms. These square waves are often called Sal and Cal after their sinewave equivalents the Sin and Cos fourier or trigonometric functions.
Although square waves are composed of only the odd n harmonics of (sin(n*w))/n they all have vertical steps and flat tops. It is therefore not possible to generate continuous smooth or rounded waveforms without bandwidth limiting the output waveform. Bandwidth limiting (low-pass filtering) removes the higher harmonics and make the square waves back into smoother sinewave functions by effectively changing the vertical step edges into ramps.
Digital to Analogue Converters also produce steep step functions but they bandwidth limit the output and support very small step sizes which makes the output of digital audio look and sound smooth.
Theoretically you can make any function you want (even a sine wave) with Sal and Cal functions. Tabulate the function you want, then compute its Inverse Hadamard Transform. You will get a flat top at each discrete value you tabulated but the steps between them will still be vertical and harmonics will still be present to infinite.
The number of points you can synthesise is half the number of harmonics you control, (Shannon’s Theorem). In this case 32 harmonics can only generate 16 discrete points in a waveform, yet you are plotting the meaningless bits in between. To see a smooth function with your synthesiser you need to draw a diagonal line from each of those 16 points to the next. This will look smoother because you are not drawing the vertical edges that do not exist. You are doing discrete transforms but plotting them as continuous transforms.
Zamaster
Posts: 1025
Joined: Jun 20, 2005 21:40
Contact:

Post by Zamaster »

Im afraid you are not correct. I have already created smooth non-flat surfaces and noted rounded surfaces(though irregular) in complex waveforms using this method.

I am plotting this as a sampled data stream, the idea is not to make a half assed wave form and then smooth it to finish the job(connecting the points with lines = linear interpolation). I instead would like the actual harmonics to create the wave, though infinite precision would ultimately be required Id like the wave to converge visualy so I can study the math behind analyzing a wave to be converted into square harmonics.

This is what I read, but did you just mean that I would need infinite precision to get a perfectly smooth wave?
Richard
Posts: 3096
Joined: Jan 15, 2007 20:44
Location: Australia

Post by Richard »

Infinite precision is not needed. This is fundamentally a problem of bandwidth. The entire universe respects the laws of information theory and data channel capacity, why should you be allowed to break them?

Code: Select all

 Const Harmonics As Integer = 32
Const VEWidth    As Integer = 768
Your input is 32 column bars. Because your output is not made from 16 column bars (or 16 points joined by 16 straight lines) you must have got information to plot between these points from somewhere else, all 752 = (768-16) of them! You cannot independently control these fine detail intermediate points because you must control at least twice as many harmonics as the number of data points you generate, that is control of 1536 harmonics are needed, not just 32. In effect the extra 752 data points you are plotting come from the square wave interpolation function you have unintentionally selected.
Fundamentally, if you control only 32 harmonics then you can only generate 16 independent data points. Likewise if you have 16 data points then only 32 harmonics are required to fully represent them. This is absolutely determined by Shannon’s Sampling Theorem and the Nyquist Frequency.
It seems that by denying the laws of information theory you have actually built the half assed synthesiser you were trying to avoid.
Zamaster
Posts: 1025
Joined: Jun 20, 2005 21:40
Contact:

Post by Zamaster »

Gotcha, thats just for visual presentation : ). The Sample array just holds the points along my fake oscilloscope.

If it were a real synthesizer right now I would fill sample data for 1 Hz using say, I dunno, 44100 samples, plot out the wave and then interpolate.

Pardon any misunderstanding.
Lachie Dazdarian
Posts: 2338
Joined: May 31, 2005 9:59
Location: Croatia
Contact:

Post by Lachie Dazdarian »

“Walsh-Hadamard” functions?
Inverse Hadamard Transform?
Shannon’s Theorem?
Nyquist Frequency?

Argh, I'm even more ignorant that I thought.

I hate you. :P
Zamaster
Posts: 1025
Joined: Jun 20, 2005 21:40
Contact:

Post by Zamaster »

You really aren't! This is some very complex stuff! Ive heard of the mathematician Hadamard but never his transform for Walsh functions. Basically, I'm trying to make any sound wave by combining a bunch of square waves together.
Richard
Posts: 3096
Joined: Jan 15, 2007 20:44
Location: Australia

Post by Richard »

This will give you some idea of the problems associated with generating smooth functions from squarewaves. Fiddle with the parameters n and f etc. Have fun.
I am not certain the code is absolutely correct, but it seems to work like I expect.
EDIT: the following code is faulty, see my Walsh Transform post at start of next page

Code: Select all

End ' faulty code
'----------------------------------------------------------
' Slow Hadamard Transform. Analyser - Synthesiser
'----------------------------------------------------------
Const As Integer n = 50     ' number of data points 10 - 5000
Const As Integer nmax = n - 1
Screen 21
Window (-1, 2)-(n, -2)
Dim As Double signal(0 To nmax)

Const As Integer f = n \ 2   ' number of frequencies
Const As Integer fmax = f - 1 
Dim As Double Calco(0 To fmax), Salco(0 To fmax)

'----------------------------------------------------------
Function Cal(Byref omega As Double) As Double
    Cal = ((Int(4 * omega)) And 2) - 1
End Function

'----------------------------------------------------------
Function Sal(Byref omega As Double) As Double
    Sal = ((Int(1 + 4 * omega)) And 2) - 1
End Function

'----------------------------------------------------------
Line (0, 0)-(n, 0),13
Const As Double Pi = 4 * Atn(1)
Const As Double TwoPi = 2 * Pi

'----------------------------------------------------------
' first initialise signal() with a known smooth function
'----------------------------------------------------------
pset (0,0),0
Dim As Double freq = 3, amp = 1, w
For i As Integer = 0 To nmax
    w = freq * TwoPi * i / n
    signal(i) = amp * .6*Sin(w) +.4*Cos(w)   ' try different blends
    'Pset (i,signal(i)),14
    line -(i,signal(i)), 14     ' plot it in yellow
Next i

'----------------------------------------------------------
' analyse signal() for square wave content (walsh functions)
' This is a slow analyser not a Fast Hadamard Transform, FHT 
'----------------------------------------------------------
Dim As Double SigmaCal, SigmaSal, sigma
For freq As Integer = 0 To fmax
    SigmaCal = 0
    SigmaSal = 0
    For i As Integer = 0 To nmax
        w = freq * i / n
        SigmaCal += Cal(w) * signal(i)
        SigmaSal += Sal(w) * signal(i)
        'If freq = 2 Then Pset (i, Sal(w)),14  ' test Sal() or Cal()
    Next i
    Calco(freq) = SigmaCal / n  ' save coefficients
    Salco(freq) = SigmaSal / n
Next freq

'----------------------------------------------------------
For i As Integer = 0 To 20 '\ use to check if freq is correct
    ' Print Using " ###   ##.####   ##.####"; i; Calco(i); Salco(i)  
Next i

'----------------------------------------------------------
' Back synthesise the smooth function we started with
' but get all the noise.....
'----------------------------------------------------------
pset (0,0),0
For i As Integer = 0 To nmax
    sigma = 0
    For freq As Integer = 0 To fmax
        w = freq * i / n
        sigma += Calco(freq) * Cal(w) + Salco(freq) * Sal(w)
        signal(i) = sigma
    Next freq
    'circle (i, signal(i)), 2, 7,,,1/100
    line -(i, signal(i)), 8
Next i

'----------------------------------------------------------
Sleep 
Last edited by Richard on Aug 19, 2007 23:32, edited 1 time in total.
Zamaster
Posts: 1025
Joined: Jun 20, 2005 21:40
Contact:

Post by Zamaster »

Is the signal really doomed to be that noisy? I have the feeling that something is awry with it. Maybe this isn't applicable to a regular sine wave, but when throwing around some random harmonics and offsets into a wave, I get (though hardly) smoother curve/hump like features than are produced with your program.

Image

If the signal is doomed to be that noisy, is there maybe a different transform that will create a better square wave representation of it?
Richard
Posts: 3096
Joined: Jan 15, 2007 20:44
Location: Australia

Post by Richard »

Yes, square waves are noisy because they have steps generating all those harmonics to infinity. We have to remove every odd harmonic of the first square wave by subtracting another square wave and introducing even more smaller odd harmonics. The best way to generate smooth signals is to use sine waves because they have no harmonics, hence fourier synthesis. There are plenty of other rectangular functions that can be used for deconvolution or synthesis but they all have the steps with harmonic problems when it comes to smooth signal synthesis.
PS
It is theoretically possible to make a sine wave from square waves but it takes many harmonics. This is how to understand it: Consider first a square wave of frequency 1 and amplitude 1. It is made from diminishing odd harmonics of the fundamental.
Sq(1) = sin(1) +sin(3)/3 +sin(5)/5 +sin(7)/7 +sin(9)/9 +sin(11)/11+sin(13)/13 +sin(15)/15 +sin(17)/17 …
Now we want to keep only the first sin(1) so we successively remove the harmonics in the signal by subtracting square waves. The first term to go is sin(3)/3 so we have to subtract the square wave;
Sq(3)/3 = sin(3)/3 +sin(9)/9 +sin(15)/15 +sin(21)/21 +sin(27)/27+sin(33)/33+sin(39)/39 +…
This leaves us with;
= Sin(1) + Sin(5)/5 +sin(7)/7 +sin(11)/11 +sin(13)/13 +sin(17)/17 +sin(19)/19 +sin(23)/23...
Next we remove square wave sq(5)/5 to kill the sin(5)/5 term.
Sq(5)/5 = sin(5)/5 +sin(15)/15 +sin(25)/25 +sin(35)/35 +sin(45)/45 …
Approx Sine = Sin(1) +sin(7)/7 +sin(11)/11 +sin(13)/13 –sin(15)/15 +sin(17)/17 +sin(19)/19 +sin(23)/23...
We just get more and more, smaller and smaller remnant harmonics as noise.
Zamaster
Posts: 1025
Joined: Jun 20, 2005 21:40
Contact:

Post by Zamaster »

That makes me feel much better about this then. So now I need to find a universal transform algorithm that breaks down a single cycle wave into TRUE square harmonics.

Good explanation on breaking down the square into a sine. I'm wondering if that needs to be the base of this future algo.

Im just totally set on synthesizing waves without using Fourier synthesis, I know on an infinite level perfect waves with steep jumps in amplitude are impossible, but they are with square waves as well as curves (on an infinite level of course).
Zamaster
Posts: 1025
Joined: Jun 20, 2005 21:40
Contact:

Post by Zamaster »

Wait, I think I got it. FFT the wave, remember 256 of the harmonics and break down the wave into a list of 256 square harmonics using the same reduction technique you used to isolate the sine. Stop once the 256th square has been added. I cant believe I hadn't thought of that yet!
Richard
Posts: 3096
Joined: Jan 15, 2007 20:44
Location: Australia

Post by Richard »

Yes, I think you have got it.
This synthesiser produces a smoothish sine wave from the square waves (walsh functions). As shown in my last post it does it by generating the Hadamard Transform of a sine wave by successive removal of harmonics of the fundamental square wave. If you replace each term in an FFT with the HT of a sine wave you have solved it. Unfortunately you need a couple of thousand harmonics to get a goodish result. Low pass filtering could bring the number of harmonics back to maybe 20. By changing n you can watch the noise fall off as the number of harmonics (bandwidth) is increased. Test it with n from about 10 to 5000.

Code: Select all

'----------------------------------------------------------
' Sinewave Synthesiser using Walsh - Hadamard Transform
'----------------------------------------------------------
' Cancel fourier harmonics of the fundamental with square waves
' to generate the Hadamard transform of a sine wave
'----------------------------------------------------------
Const As Integer n = 100     ' number of data points, adjust this 
Const As Integer nmax = n - 1
Const As Integer f = n * 2   ' fixed by n
Const As Integer fmax = f - 1 
Const As Double TwoPi = 8 * Atn(1)
' in this code we will map {0 to n} as {0 to TwoPi}

'----------------------------------------------------------
Dim As Double coeff(0 To f), amplitude, sigma, w 

'----------------------------------------------------------
' We here define Sal as a square sine wave
Function Sal(Byref omega As Double) As Double
    Sal = 1 - (2 And (Int(4 * omega)))
End Function

'----------------------------------------------------------
' We here define Cal as a square cosine wave
Function Cal(Byref omega As Double) As Double
    Cal = 1 - (2 And (Int(1 + 4 * omega)))
End Function

'----------------------------------------------------------
Screen 21
Const As Double ymax = 2 
Window (-1, ymax)-(n, -ymax)

'----------------------------------------------------------
Line (0, 0)-(n, 0),13           ' draw x-axis

'----------------------------------------------------------
pset (0,0),0
for i as integer = 0 to nmax
    line -(i, sin(TwoPi*i/n)),14 ' draw fourier sine or cosine wave
next i

'----------------------------------------------------------
pset (0,0),0
for i as integer = 0 to nmax
    line -(i, Sal(i/n)),13  ' draw square Sal or Cal wave
next i

'----------------------------------------------------------
' first fill the coeffficients() with Square wave
'----------------------------------------------------------
' the area of a Sal wave is more than the equivalent sine wave
dim as double scale = TwoPi / 8 ' check this it might be wrong derivation
For harmonic As Integer = 1 To fmax Step 2
    coeff(harmonic) = scale / harmonic    ' odd harmonics only
Next i

'----------------------------------------------------------
' Then remove successivly by subtracting all but the first sinewave.
' This does the spectrum subtraction to remove sine wave harmonics and
' sweeps through replacing     fourier with walsh functions
'           that is         sine waves with square waves
'----------------------------------------------------------
For sweep As Integer = 3 To fmax Step 2  'we want to keep the fundamental
    amplitude = coeff(sweep)   ' this sine wave coefficient
    
    ' now we subtract the spectrum of square wave to cancel fourier term
    For harmonic As Integer = 3 To (fmax/sweep - 1) Step 2
        coeff(harmonic*sweep) -= amplitude / harmonic
    Next harmonic
    
    coeff(sweep) = -amplitude   ' replaced with square wave coefficient
    if inkey <> "" then end
Next sweep


'----------------------------------------------------------
dim as integer limit = 25
if fmax < limit then limit = fmax
For i As Integer = 1 To limit
  ' print using "###  ##.###### "; i; coeff(i)
Next

'----------------------------------------------------------
' plot the remaining approximation of sine wave
'----------------------------------------------------------
Pset (0,0),0
For i As Integer = 0 To nmax
    sigma = 0
    For freq As Integer = 1 To fmax Step 2
        w = freq * i / n
        sigma += coeff(freq) * Sal(w)
    Next freq
    Line -(i, sigma), 15
    if inkey <> "" then end
Next i

'----------------------------------------------------------
Sleep 
EDIT: P.S.
You don’t need to do an FFT then insert the HT of a sine wave for each term. You only need to compute the FHT of your wanted signal.

The Fast Hartley Transform FHT should be faster than the Fast Fourier Transform FFT because walsh functions have a fixed value of +1 or −1 only, so no lookup table needed, Pi doesn’t need to get a show. The FHT uses the same butterfly structure as the FFT. See http://en.wikipedia.org/wiki/Discrete_Hartley_transform

The problem with HT for smooth signals is the need for bandwidths 100s of times the highest frequency present, whereas the FT only needs twice the highest frequency present, (the Nyquist frequency). Where the HT is used for digital data it needs much less bandwidth, I think twice the data rate, or for bit pattern convolution the number of bits can equal the number of cefficients.

As suggested, I now suspect there is something awry with my original crude slowHT code. (I was asleep when I wrote it), I may take another look.

The problem and pleasure with this subject is exploring, getting to know, understand and apply what are incredibly elegant concepts. It is 25 years since I last toured this region and it is as beautiful as I remember it. Thanks for the reintroduction.
Zamaster
Posts: 1025
Joined: Jun 20, 2005 21:40
Contact:

Post by Zamaster »

Thats cool! I have to ask, what degree(s) do you have?

So wait, an FHT is just the transform I need?
Richard
Posts: 3096
Joined: Jan 15, 2007 20:44
Location: Australia

Post by Richard »

Absolutely no degrees whatsoever. The last academic qualification I got was my high school certificate at age 16. Qualifications are limitations. You too can be an unqualified success, but I don’t recommend it if you are able to understand numerical transforms because qualification certificates = financially secure income. I just follow my interests.
Yes, I think the FHT can be used to both analyse your signal and the inverse FHT could synthesise the output. Although I don’t see why you could need to do both because they cancel. If you built a hardware signal generator based on square waves then you could use the FHT to calculate the signal you want generated. The hardware design could be based on the “Direct Digital Synthesiser(s)” but economic hardware design would probably be based on the structure of the Inverse FHT, these days it would be implemented with a signal processor.
With the FHT the forward and reverse transforms are identical with the exception of no internal scaling in the reverse direction. Historically the HT was seen as a variant or substitute of the FT but there seems no need for the trigonometric tangle of sine, cosine or TwoPi originally included.
Post Reply